
How to Calculate a Product Carbon Footprint: A Step-by-Step Guide for Textile Manufacturers and Fashion Brands
Learn how to calculate a product carbon footprint (PCF) using ISO 14067, formulas, textile examples, emission factors, and supplier data.

A product carbon footprint (PCF) measures the greenhouse gas emissions and removals associated with a product within a defined life cycle boundary, expressed in kilograms of carbon dioxide equivalent (kg CO₂e). This guide walks textile manufacturers and fashion brands through setting the boundary, gathering supplier data, calculating emissions and reporting the result.
In brief: Define the product and reporting unit, map the processes in scope, collect activity data and emission factors, allocate shared emissions, then validate and document the result.
What is a Product Carbon Footprint?
A PCF quantifies climate-change impact for a specific product over a stated life-cycle boundary. Greenhouse gases are converted to CO₂ equivalent so different gases can be expressed in one unit. A textile mill might assess 1 kg of dyed fabric at the factory gate; a fashion brand might assess one cotton T-shirt over its life cycle. The question is: how much climate impact is associated with making, using and disposing of this product within the stated boundary?
ISO 14067 addresses climate change, not water scarcity, toxicity, biodiversity or every other environmental impact.
PCF vs LCA vs corporate carbon footprint
At a glance: A PCF reports product climate impact. An LCA covers multiple environmental impacts. A corporate inventory tracks organizational emissions across Scopes 1, 2 and 3. PEF applies the EU environmental footprint method.
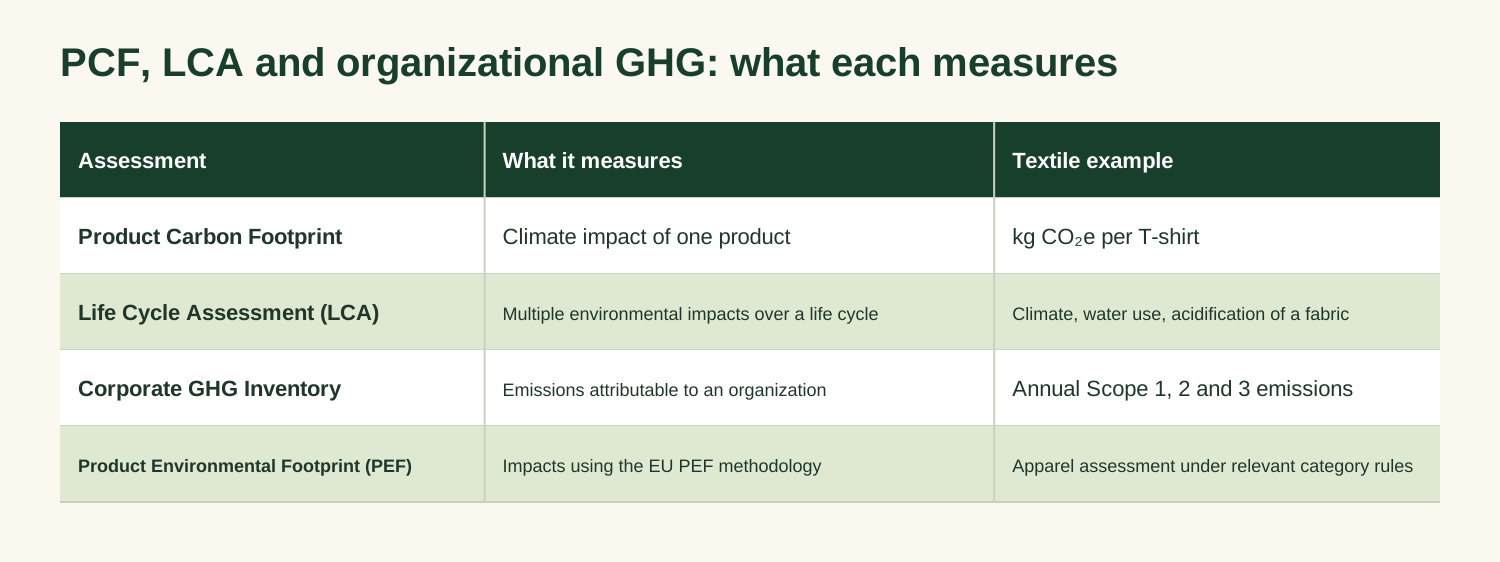
Comparison of PCF, life cycle assessment, corporate GHG inventories and EU Product Environmental Footprints with textile examples.
A product cradle-to-gate PCF may contribute to a buyer’s Scope 3 purchased-goods inventory, but the two are not interchangeable: one measures a product and the other a company’s value-chain emissions.
Which standards and methods apply?
Choose the method by purpose: ISO 14067 for product carbon footprints, the GHG Protocol Product Standard for life cycle GHG inventories, ISO 14040/14044 for LCA, PACT for supplier PCF data exchange, and apparel and footwear PEFCR for broader environmental assessment.
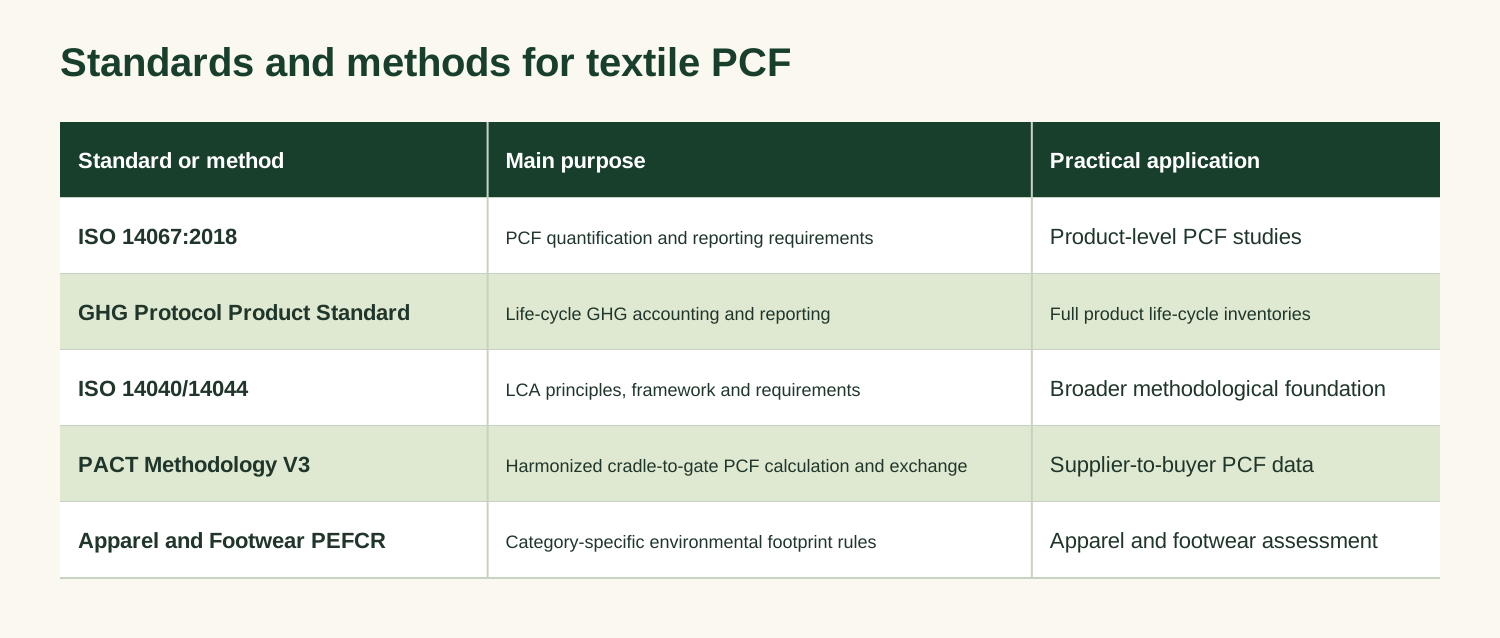
Five standards and methods for textile PCFs, with their purposes and practical applications.
ISO 14067:2018 was reviewed and confirmed in 2024. PACT Methodology V3 was released in April 2025, replacing V2 for new calculations under PACT guidance. A cradle-to-gate PCF is a partial footprint. Under the GHG Protocol Product Standard, final products require cradle-to-grave coverage for a complete product inventory; a partial inventory should be identified and justified.
How do you calculate a PCF?
PCF = Σ (Aᵢ × EFᵢ), where Aᵢ is activity data for process i, EFᵢ is its appropriate greenhouse-gas emission factor, and n is the number of included activities. This simplified equation assumes factors already express relevant gases in CO₂e. A complete study must also address allocation, removals, land-related emissions and other applicable methodological requirements.
Example: if knitting consumes 0.8 kWh per kg of fabric and the applicable electricity factor is 0.5 kg CO₂e/kWh, electricity emissions are 0.8 × 0.5 = 0.40 kg CO₂e per kg of fabric. This is one process contribution, not the whole fabric footprint.
Step 1: Define the product and functional unit
The unit determines what the result represents. For an intermediate textile, 1 kg of dyed fabric at the factory gate may be suitable. For apparel, describe the product’s function and, where relevant, service life: for example, one cotton T-shirt delivering a specified number of wears under stated care conditions. A one-kilogram fabric comparison is not automatically equivalent to comparing garments that perform the same function.
Step 2: Define the system boundary
Cradle-to-gate covers upstream raw materials and manufacturing through the specified factory gate. Cradle-to-grave also includes downstream distribution, use and end-of-life. Transport and intermediate inputs belong within the relevant stages; do not omit them merely because they cross stages. Choose the boundary based on the study objective, applicable standard, product rules and customer requirements.
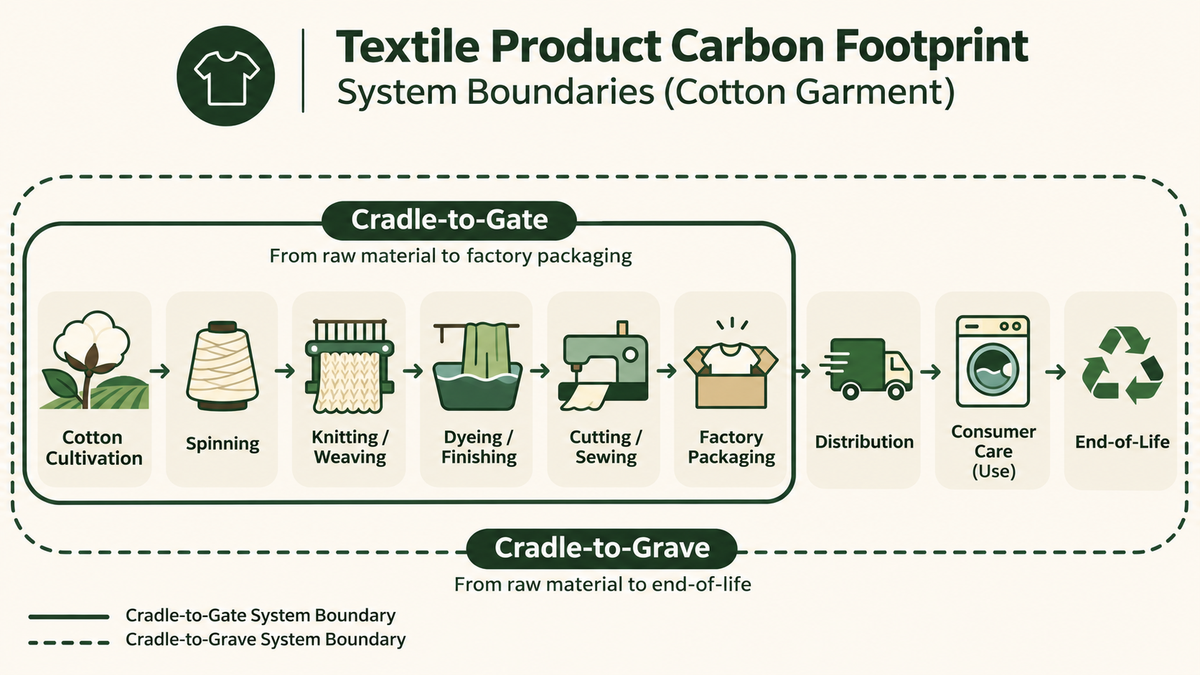
Cotton apparel life cycle showing where cradle-to-gate ends and how cradle-to-grave extends through disposal.
Step 3: Map the textile production chain
A typical cotton garment chain includes cultivation and ginning, spinning, knitting or weaving, dyeing and finishing, cutting and sewing, packaging, distribution, consumer use and end-of-life. Include relevant fertilizers, chemicals, fuels, purchased materials, electricity generation and transport. For blends, model each fibre constituent and its upstream processes.
Step 4: Collect primary activity data
Start with the records you already have: farm and fibre records, meter readings and production logs, utility bills and batch records, cutting and sewing records, freight data, and documented consumer care assumptions.
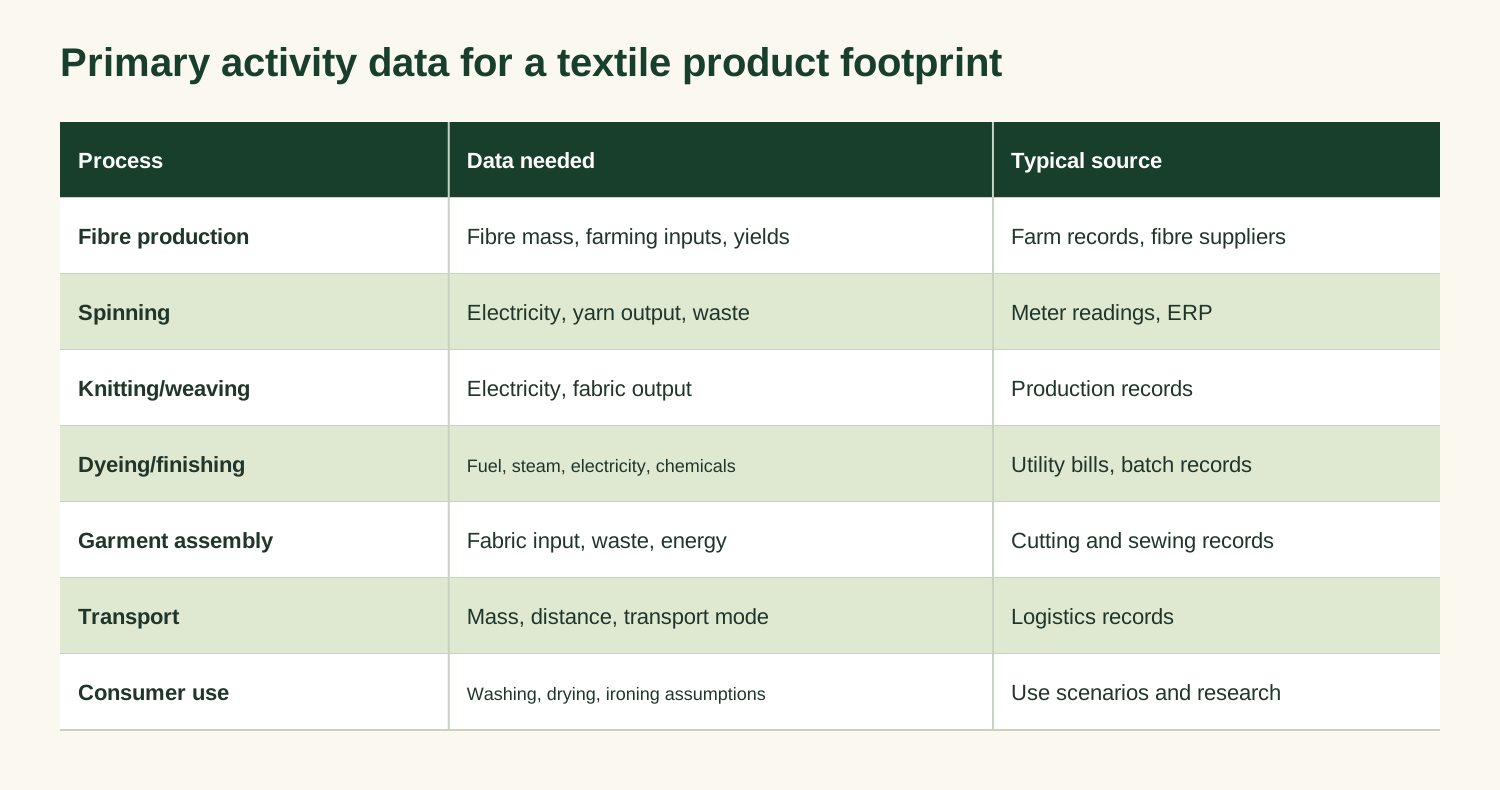
Activity data and typical records for seven stages of the textile life cycle.
Use supplier-specific data where available and suitable secondary datasets for gaps. Record period, geography, technology, units and source. Do not assign a supplier’s total annual electricity to one product; allocate it using an appropriate, documented relationship.
Step 5: Select appropriate emission factors
Factors convert activity into emissions, such as kg CO₂e/kWh for electricity, kg CO₂e/kg for materials or kg CO₂e/tonne-km for freight. Match geography, year, technology and system boundary. For electricity, distinguish the chosen accounting method and contractual evidence. Avoid double counting upstream fuel-cycle emissions already included in a life-cycle electricity factor. For cotton and other biobased fibres, assess land-use change, agricultural emissions, biogenic carbon and removals under the selected method; do not assume biogenic carbon is automatically zero-impact.
Step 6: Allocate shared emissions correctly
A spinning mill may share electricity, compressed air and services among yarn products. Where direct metering is unavailable, use a documented and defensible allocation such as machine operating hours, measured power demand or another relevant physical relationship. If a process has 12,000 kg CO₂e of shared emissions and 20,000 kg eligible output, mass allocation gives 12,000 ÷ 20,000 = 0.60 kg CO₂e/kg. Use this only when consistent with the applicable allocation hierarchy and process relationships. Avoid dividing all factory emissions by total product mass where products have materially different energy intensities.
Step 7: Calculate, validate and report
Calculate each stage separately, then aggregate. Check mass balances, unit conversions, yields, energy reconciliation, emission-factor boundaries, allocation, completeness and assumptions. Retain source documents, factor versions, allocation rules, approvals and calculation methodology. Never describe an unverified internal calculation as independently verified.
Worked example: one cotton T-shirt
The following is a hypothetical teaching example for a 180-gram cotton T-shirt, not a measured industry average or FairlyGreen platform result. It covers cradle-to-gate activities through packaging at the garment factory and excludes downstream distribution, consumer use and end-of-life.
Hypothetical breakdown, in kg CO₂e per shirt: cotton fibre 0.55, spinning 0.40, knitting 0.20, dyeing and finishing 0.75, cutting and sewing 0.25, and packaging and included transport 0.15. Total: 2.30 kg CO₂e.
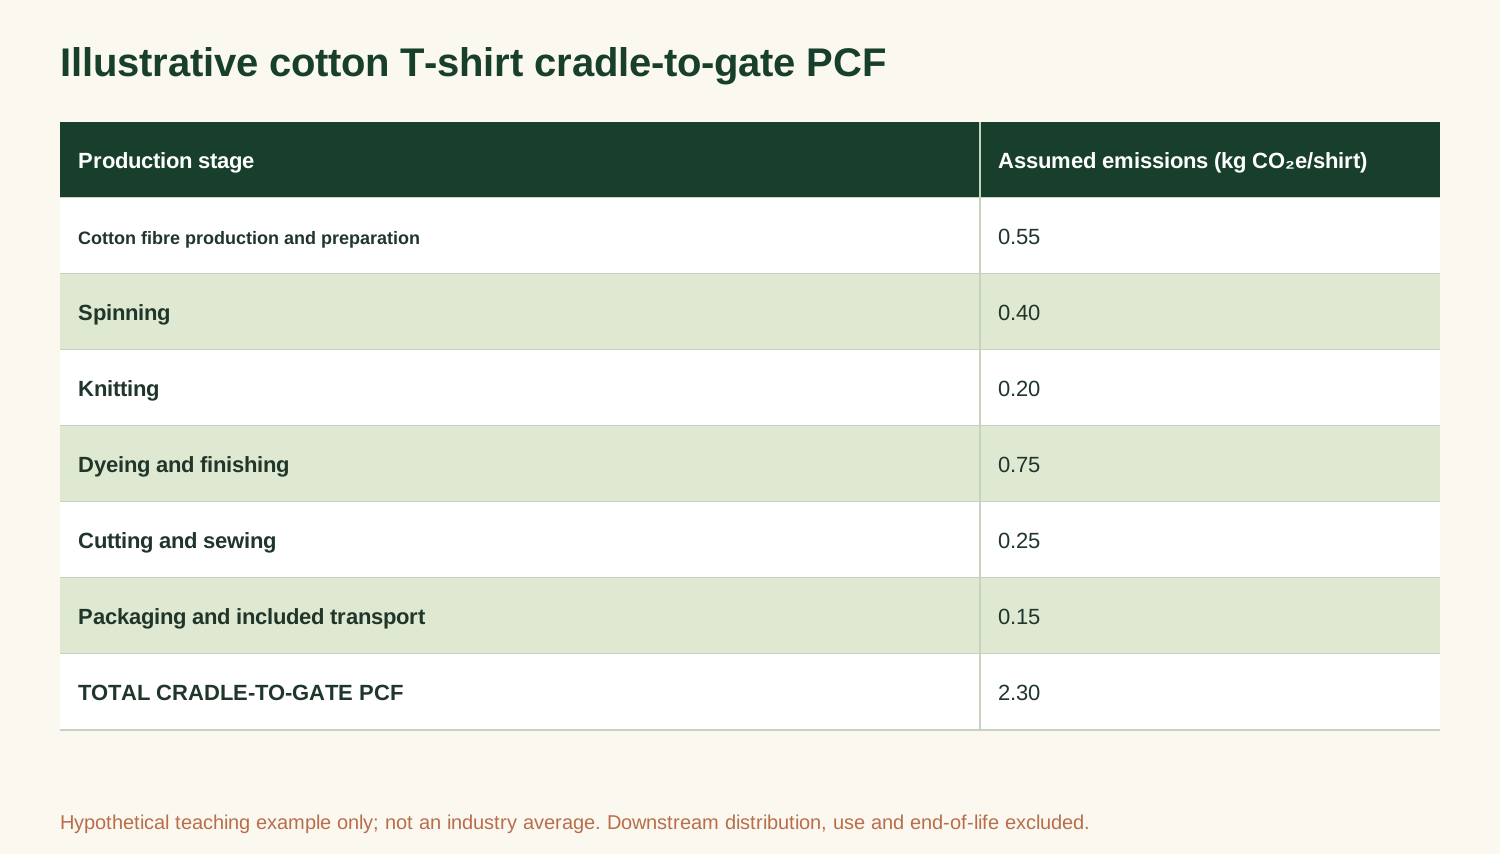
Six hypothetical cotton T-shirt production contributions totaling 2.30 kg CO₂e per shirt at the factory gate.
In this hypothetical scenario, dyeing and finishing is the largest listed contribution, so process efficiency, energy and rework could be investigated as reduction opportunities. Do not treat the total or stage values as industry benchmarks. Manufacturing losses increase upstream material requirements. At a cumulative material yield of 72%, a 180 g finished T-shirt requires 0.180 ÷ 0.72 = 0.250 kg of starting material.
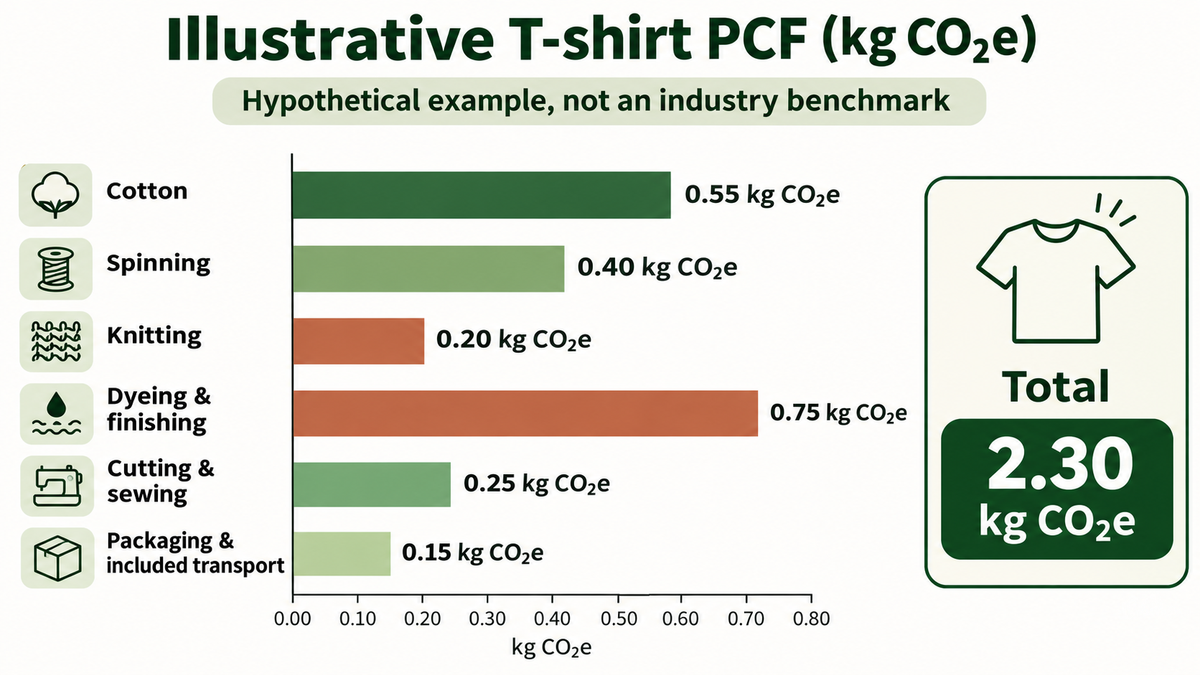
Hypothetical cotton T-shirt emissions by production stage. Dyeing and finishing contributes the most at 0.75 kg CO₂e per shirt.
Common PCF challenges and how to address them
Improve data quality: prioritize missing data for high impact processes, standardize units and reporting periods, document allocation, track factor versions, align product comparisons, and set recalculation triggers.
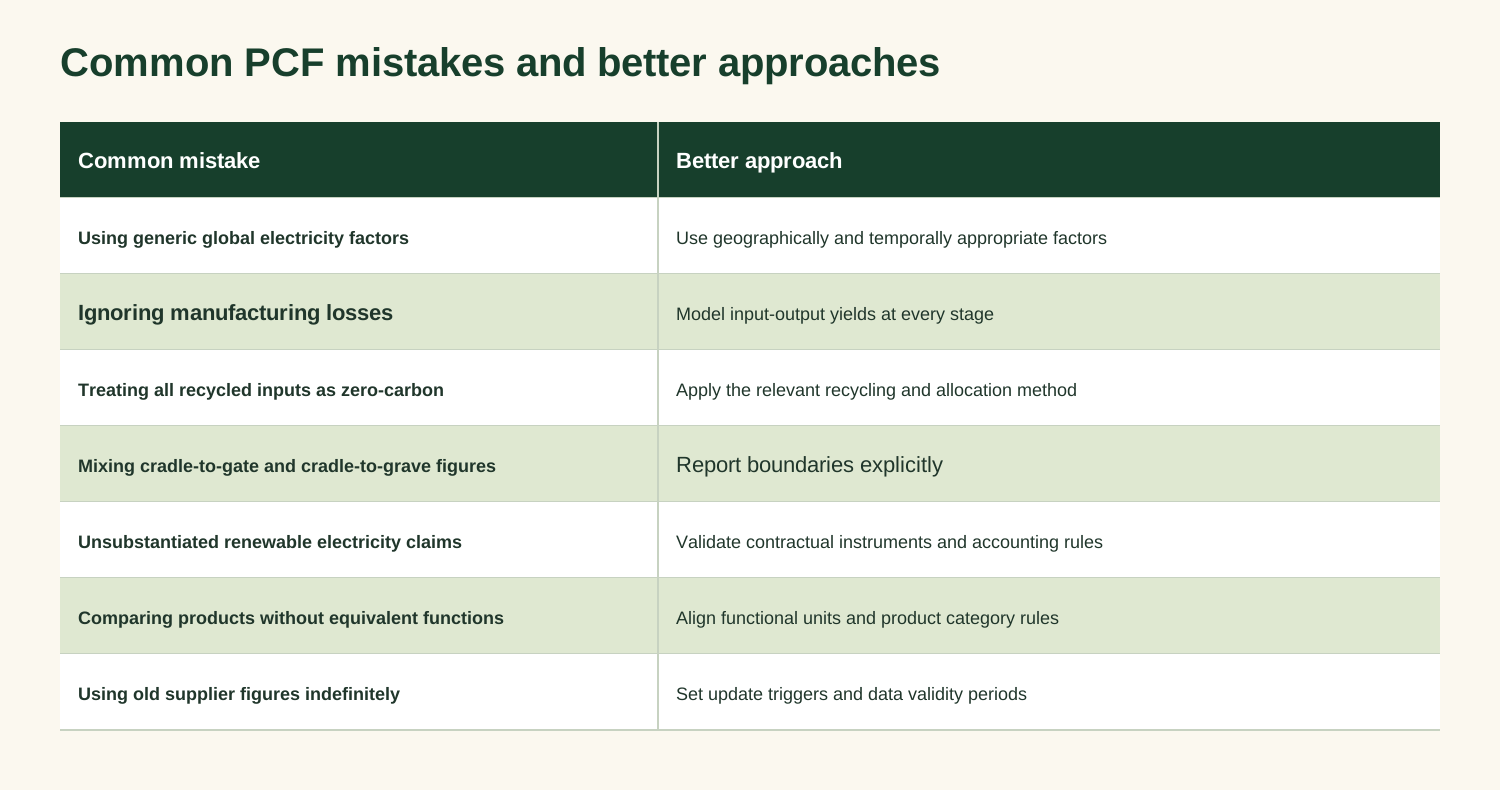
Common PCF mistakes and corresponding ways to avoid them.
The GHG Protocol calls for primary data for processes under the reporting company’s ownership or control and data-quality assessment across the inventory.
How PCF data can support emissions reduction
Use results to identify measurable opportunities. A textile manufacturer might compare boiler fuels, improve steam-system efficiency, reduce dyeing rework, increase fabric yield or assess fibre sourcing. A brand might use product results for material selection, supplier engagement and design. A lower reported footprint does not necessarily mean physical emissions fell: factors, methods, product specifications or data quality can change the result. Use consistent baselines and investigate material differences before making reduction claims.
Is PCF reporting mandatory?
There is no universal requirement for every textile product worldwide to have a PCF. Obligations depend on jurisdiction, product category, legislation and contracts. In the EU, the Ecodesign for Sustainable Products Regulation (EU) 2024/1781 establishes a framework for product-specific requirements. As of 14 November 2026, the European Commission indicates that a textile-specific delegated act, including relevant Digital Product Passport requirements, is planned for Q4 2027; precise data obligations and dates depend on subsequent legal measures. The Apparel and Footwear PEFCR, welcomed by the Commission in June 2025, provides a broader environmental assessment method and is not a universal legal mandate to publish an ISO 14067 PCF. For exporters in Pakistan, Bangladesh, India, Vietnam and elsewhere, buyer requirements may create commercial demand before specific legal obligations apply.
How software can improve reliability
Spreadsheets can support initial calculations. Across many styles, facilities and suppliers, structured systems help with consistency, version control, allocation and evidence. Connect facility, activity, evidence, factors, PCF calculation, review and disclosure. Retain activity records, factor versions, allocation rules, approval status and evidence for every result. PACT Methodology V3 and Technical Specifications V3 support standardized exchange of product-level emissions data. Reusing supplier information can support product footprints, corporate Scope 3 inventories and future disclosures without repeatedly requesting the same data.
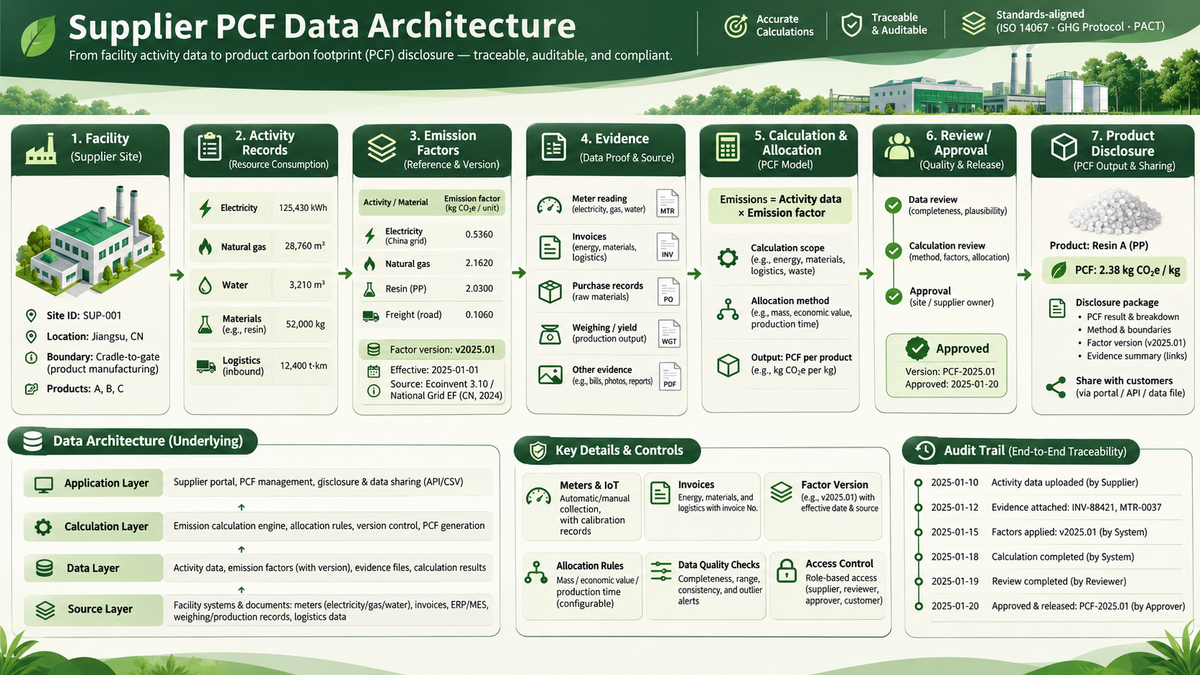
Supplier PCF workflow from facility records and emission factors through calculation, approval and disclosure.
Practical PCF implementation checklist
- Define the product, purpose and reporting unit. (Core study requirement)
- Select and document the applicable methodology. (Core)
- Specify the life-cycle boundary and exclusions. (Core)
- Create a complete process and material-flow map. (Core)
- Collect primary data for controlled processes. (Core)
- Document factors, allocation and assumptions. (Core)
- Validate mass, energy and emissions calculations. (Core)
- Assess supplier-data quality and material gaps. (Recommended)
- Retain evidence and establish review responsibilities. (Recommended)
- Identify hotspots and model reduction scenarios. (Good practice)
- Establish supplier PCF exchange and update procedures. (Good practice)
“Core” describes requirements for a defensible study under the chosen methodology, not universal legal mandates. Exact obligations depend on the standard and study scope.
Frequently asked questions
What is the carbon footprint of one cotton T-shirt?
There is no single universally valid value. Results depend on garment weight, fibre sourcing, technology, electricity, production efficiency, use assumptions and boundary. The 2.30 kg CO₂e cradle-to-gate example above is hypothetical and not an industry benchmark.
Can I calculate PCF using Excel?
Yes. A structured spreadsheet can work if it includes complete activity data, appropriate factors, consistent allocation, version control, validation and documented assumptions. Specialized software is more useful as products, facilities, suppliers and reporting cycles multiply.
Is ISO 14067 certification mandatory?
Not universally. ISO 14067 provides quantification and reporting requirements and guidelines. Independent verification depends on intended claims, contracts and applicable program rules; the standard does not create a universal legal certification requirement.
Can two textile products’ PCFs be compared?
Only when the comparison is methodologically justified. Functional units, boundaries, data quality, allocation and product rules must be sufficiently aligned. Two kg CO₂e values alone are not automatically comparable.
How often should a PCF be updated?
There is no universal annual rule. Recalculate when material inputs, processes, energy or other significant assumptions change, and follow the method’s validity rules. PACT V3 includes recalculation guidance for major process changes and significant biogenic or land-sector considerations.
Can a PCF be used in a Digital Product Passport?
Potentially, as supporting product-level environmental information. Required fields depend on applicable DPP legislation and product rules. A calculated PCF alone is not a compliant Digital Product Passport.
Key takeaways
- A PCF measures climate impact, not total environmental sustainability.
- Reliable results depend on boundaries, representative activity data, factors and allocation.
- Textile manufacturing losses must be reflected in upstream material needs.
- Cradle-to-gate is not the same as a complete cradle-to-grave footprint.
- Product results are most useful when they support supplier engagement and measurable reductions.
- Transparent evidence and consistent methods matter more than apparent numerical precision.
Turn product carbon data into actionable sustainability intelligence
FairlyGreen focuses on connecting GHG accounting, product-level environmental assessment and supplier traceability for fashion and textile supply chains. Book a demo to explore how FairlyGreen can help turn fragmented sustainability data into structured, audit-ready intelligence. Explore FairlyGreen.
Further reading
- ISO 14067:2018
- GHG Protocol Product Standard
- PACT Methodology and Technical Specifications
- European Commission Environmental Footprint methods
- European Commission: Ecodesign for Sustainable Products Regulation
- UK Government GHG Conversion Factors 2026
- US EPA GHG Emission Factors Hub
- IEA Emissions Factors 2026 (country-specific electricity and heat data)
Source-use caution: organizational reporting factors are not automatically cradle-to-gate life-cycle factors. Check coverage, gases, geography and upstream boundaries. Editorial verification date: 14 November 2026; review standards, regulations and methods before future updates.
For the current scope of textile Digital Product Passport requirements, see the European Commission’s textile apparel timeline. For supplier footprint calculation and exchange, see PACT Methodology V3 and the PACT Technical Specifications V3.
Share this article
Help others discover this content
Similar Articles

Digital Product Passports: A Practical Buyer’s Guide for Fashion and Textile Teams
Digital Product Passports are becoming a practical compliance and product-data challenge for fashion and textile teams. Here’s what buyers should understand before selecting a DPP solution.

Digital Product Passport for Textile Apparel: A Beginner’s Guide
Understand digital product passports for textiles and apparel, the EU regulatory timeline, essential product data, and practical steps to prepare.

EU Textile Sustainability Regulations 2026: The Practical Guide for Fashion, Apparel and Footwear
A practical 2026 guide to EU textile sustainability regulations covering ESPR, DPP, EPR, PPWR, green claims, CSRD, CSDDD, forced labour and EUDR.